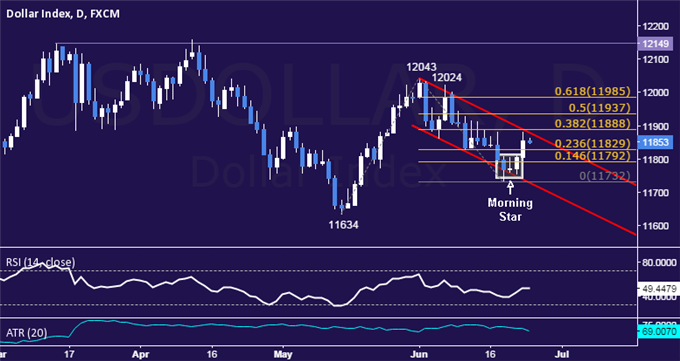
US DOLLAR TECHNICAL ANALYSIS – Prices moved higher as expected after producing a bullish Morning Star candlestick pattern. A daily close above the 38.2% Fibonacci expansion at 11888 exposes the 50% level at 11937. Alternatively, a reversal below the 23.6% Fib at 11829 clears the way for a test of the 14.6% level at 11792.
** The Dow Jones FXCM US Dollar Index and the Mirror Trader USD basket are not the same product.
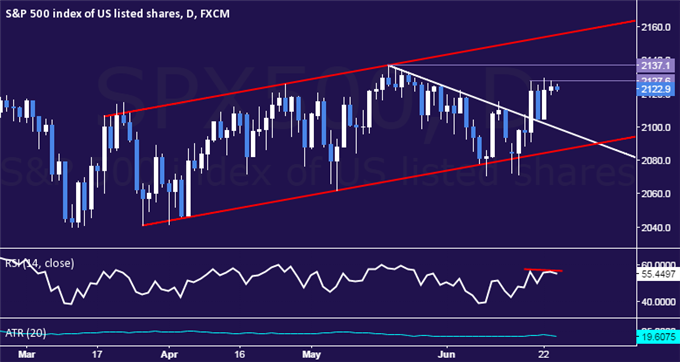
S&P 500 TECHNICAL ANALYSIS – Prices may be preparing to turn lower as negative RSI divergence hints at ebbing upside momentum. A turn below trend line resistance-turned-support at 2099.10exposes the channel floor at 2085.40. Alternatively, a push above the 2127.60-37.10 area (May 19, June 18 highs) targets channel top resistance at 2155.00.
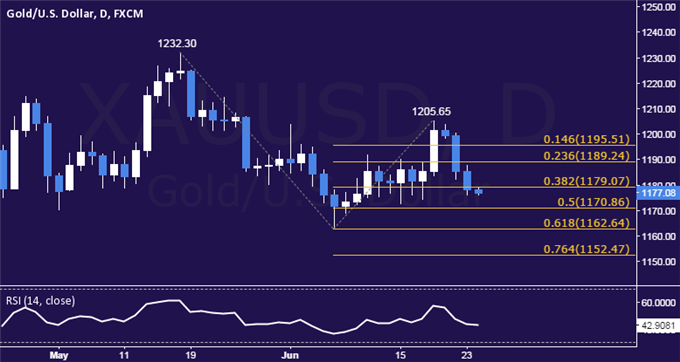
GOLD TECHNICAL ANALYSIS – Prices continued to push lower after erasing last week’s post-FOMC advance. From here, a break below the 50% Fibonacci expansion at 1170.86 exposes the 61.8% level at 1162.64. Alternatively, a move above the 38.2% Fib at 1179.07 targets the 23.6% expansion at 1189.24.
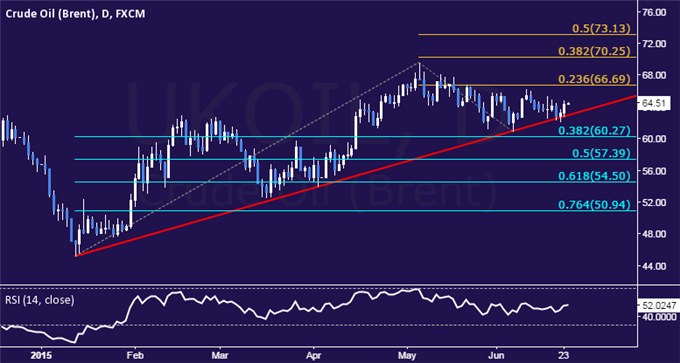
CRUDE OIL TECHNICAL ANALYSIS – Prices broke support guiding the recovery from mid-January, suggesting the longer-term down trend is resuming. From here, a break below the 38.2% Fibonacci retracement at 60.27 exposes the 50% level at 57.39. Alternatively, a move back above the trend line support-turned-resistance at 63.88 eyes the 23.6% Fib expansion at 66.69.
1 comments:
Nice Article, I Really Like The Way You Set Things Out In An Easy Way To Understand <a href="https://login07.com/trade245-review/
Post a Comment