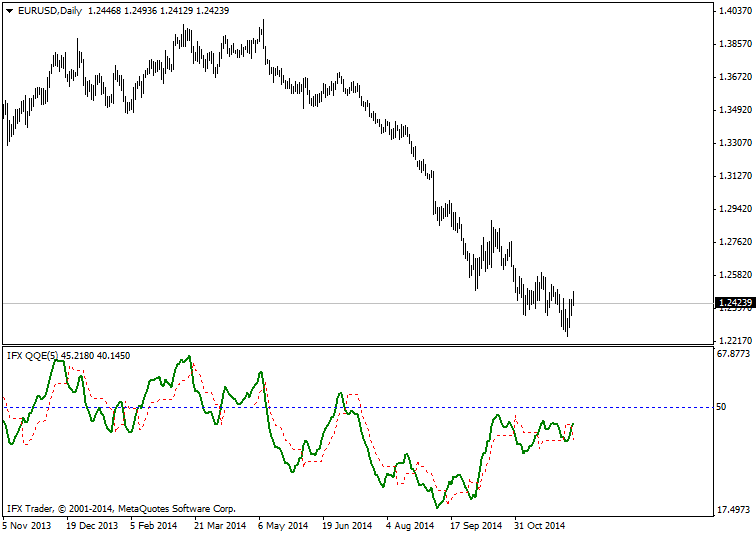
IFX_QQE indicator
Description
IFX_QQE is a technical indicator for MetaTrader that traders can apply on the forex market. QQE was invented on the basis of developed and modified RSI by famous Russian trader Roman Ignatov.
Formula
Rsi_r:= (rsiprice – ref(rsiprice,-1));
Rsi_rs:= Wilders(if(rsi_r>0,rsi_r,0),rsiperiods) / Wilders(if(rsi_r<0,Abs(rsi_r),0),rsiperiods);
RSIndex:= Mov((100-(100/(1+rsi_rs))),SF,ST);
Trading use
1. A buy signal is formed when the red line of IFX_QQE crosses the green line of the indicator upward. The upward crossing of 50 level by the green line is also considered as a buy signal.
2. A sell signal is created when the red line of IFX_QQE crosses the green line of the indicator downward. The downward crossing of 50 level by the green line also indicates a sell signal.
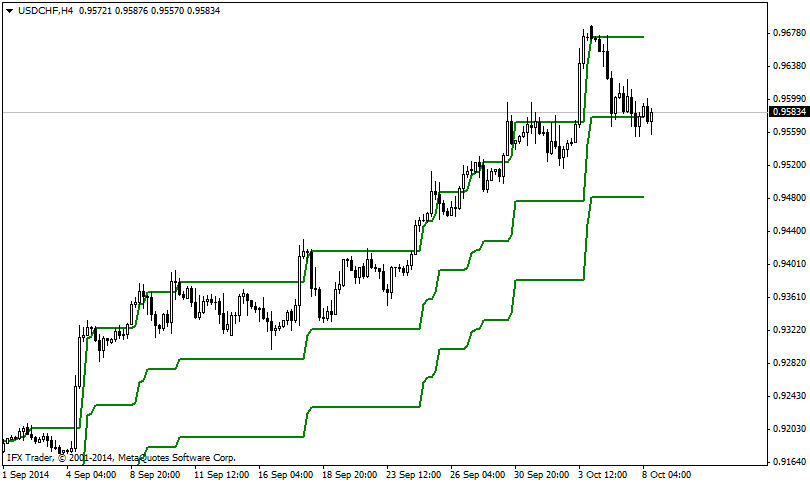
Description
The IFX_PCC is a modified version of the Price (Donchian) Channel indicator. In contrast to the classical channel indicator, a computer-based PCC is built according to a percentage value of a channel deviation from a price specified by user.
Formula
An upper bound of a channel = the highest price value depending on the percentage deviation set by user (on default 2.0).
A lower bound of a channel = the lowest price value depending on the percentage deviation set by user (on default 2.0).
Trading use
In the IFX_PCC indicator the prices generate signals for buying or selling an asset. These prices moving inside the channel for a long time, finally, breach its limits. In this regard, the most profitable moment for a breakdown is the situation when the candle which formed a signal completely covers the upper and the lower bound of the channel.
An important requirement for using the indicator in MetaTrader platform is the filtration of signals which appear at channels’ range breakdown by the price. It is possible to use the ADX indicator pointing to the trend’s strength together with the IFX_PCC:
- In case of the breakdown formation of the channel’s upper bound and the ADX indicator growth above the level of 30, the asset must be purchased.
- In case of the breakdown formation of the channel’s lower bound and the ADX indicator growth above the level of 30, the asset must be sold.
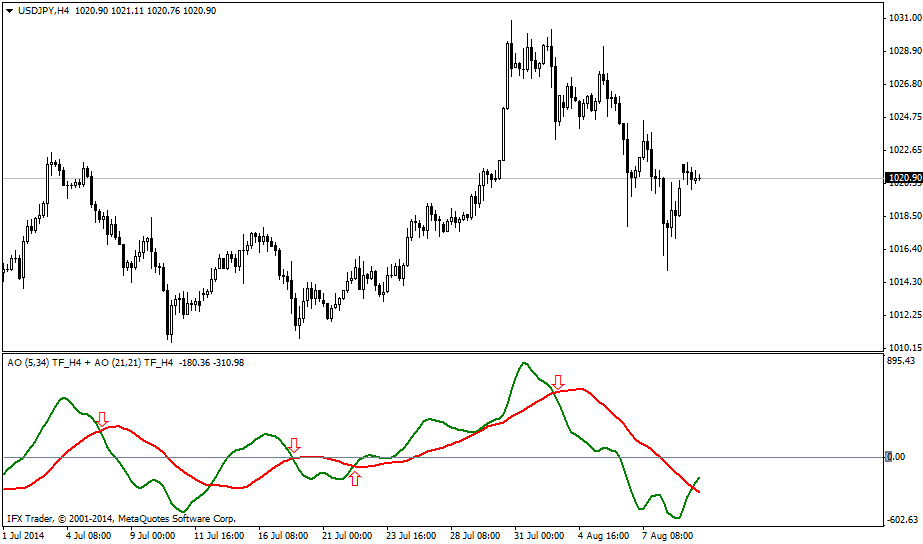
IFX_DAO indicator
Description
IFX_DAO indicator (Double Awesome Oscillator) is a variant of Awesome Oscillator by Bill Williams presented in his trading chaos theory. The indicator consists of two Awesome Oscillator’s lines, rapid and slow.
Formula
Median price = (HIGH + LOW) / 2
Awesome Oscillator = SMA (Median price, 5) — SMA (Median price, 34)
Trading use
Used in Meta Trader 4, this oscillator combines two Awesome Oscillator’s indicators which are displayed on the chart as a histogram.
Here are the basic rules of trading according to Double Awesome Oscillator:
- The indicator gives a buy signal when a red histogram of rapid Awesome Oscillator (AO) crosses a green histogram of slow AO from bottom to top
- Traders should sell when a red histogram of rapid AO crosses a green line of slow AO from top to bottom
- Trades should be closed when histograms intercross backwards
- You should refrain from trading when the indicator’s lines are directed sideways. You had better open a trade when you can see an obvious trend has been formed for a certain financial asset
- In case you see that indicator’s lines show mixed movement, you should trade in the direction of a slow AO’s line
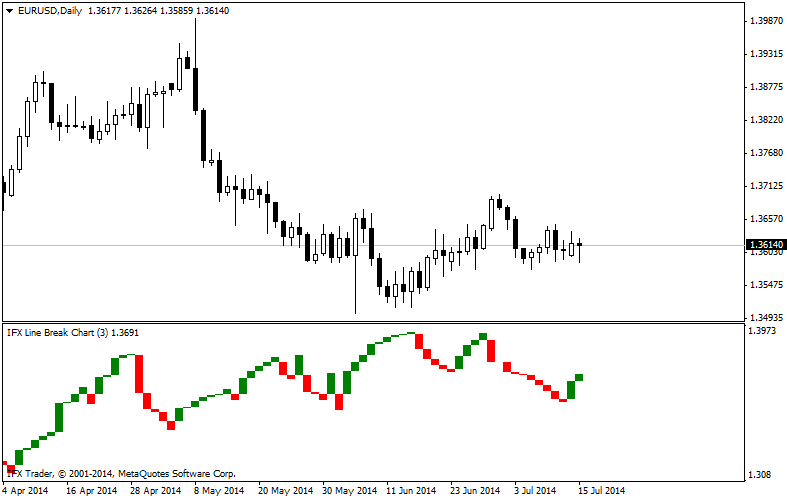
Three Line Break (TLB) Charts
Description
The Three Line Break charts are displayed in a separate window to gain clearer perception of signals. The TLB charts were first introduced by Steve Nison in his book Beyond Candlesticks in 1994.
Formula
Each new white line is drawn if the current Close t exceeds High t-1. The white line runs from the level of High t-1 to High t.
- Each new black line is drawn in case the current Close is below the price Low of the last trading day. The black line is drawn from the Low t-1 level to Low t.
- If each current Close t price does not exceed the trend or the change is not enough for reversal, no lines are added.
Trading use
Three Line Break charts display a series of vertical white and black lines or vertical boxes. White lines represent rising prices, while black lines portray falling prices. Three Line Break charts evolve based on price, not time.
The rules for a three-line break chart are the following:
- Buy when a white line appears after three adjacent black lines (a “white turnaround line”)
- Sell when a black line appears after three adjacent white lines (a “black turnaround line”)
- Refrain from trading when white lines alternate with black ones.
It is the price action which gives the indication of a reversal. The disadvantage of the TLB charts is that the signals of reversal appear after the new trend is underway.
You can adjust the time of delay between the periods when reversal signals occur. For short-term trading you can use 2-line breaks, while for long-term trading, you can make use of 4-line or even 10-line breaks.
Steve Nison recommends using the Three Line Break charts together with the Japanese candlesticks. The TLB charts will help you to determine the prevailing trends, while the candlesticks will show the right time for entering or exiting the market.
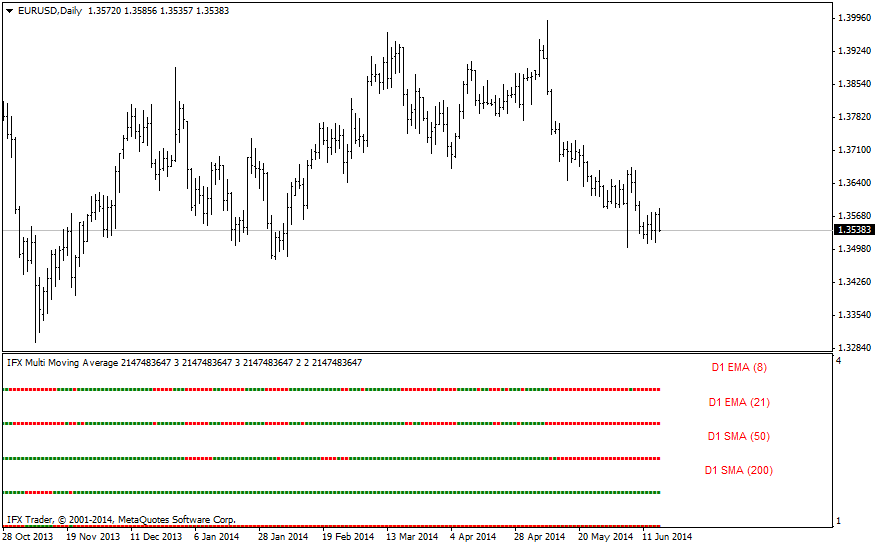
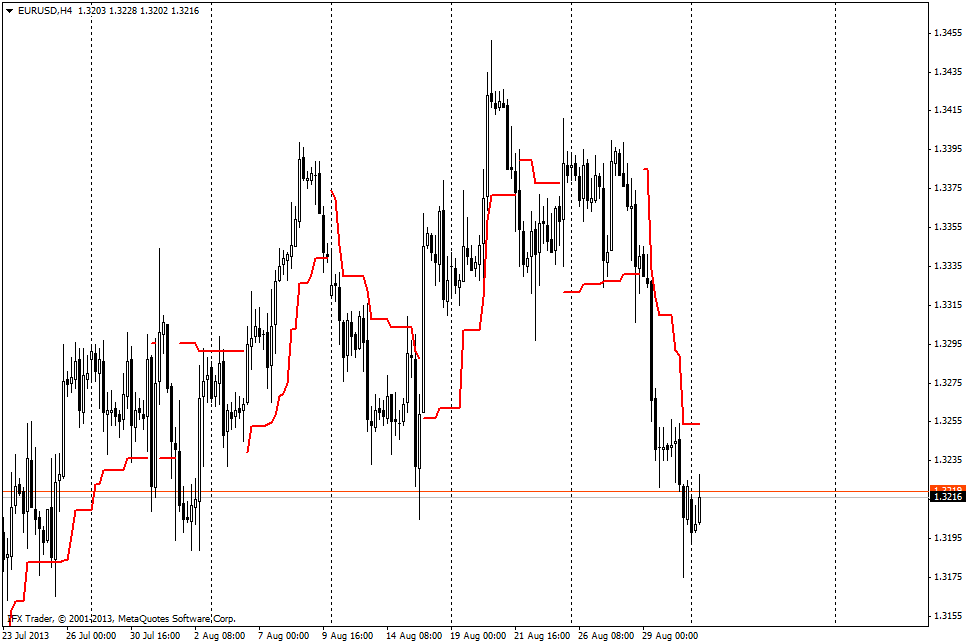
IFX_MultiMovingAverage
Description
IFX_MultiMovingAverage is the indicator enabling users to determine the direction of several moving averages on one time frame and understand what trend currently prevails. Users can enter their own values and types of moving averages.
Formula
SMA = Sum(Price)/n, where
Price — price at the moment from 1 to n;
n — moving average period.
Trading use
Various types of moving averages represent a popular analysis tool. Despite a large number of periods and types of MA calculation, practical use of moving averages is based on two factors: possibility to determine the trend direction with the help of MA and breakout/bounce trading from the level of this indicator.
Using IFX_MultiMovingAverage in MetaTrader, traders can easily figure out the trend showed by any of four moving averages applied in the indicator. The color of the indicator signals the trend direction: red color of moving averages in the extra window of the indicators means that the moving average is downward. Green color of IFX_MultiMovingAverage indicates an uptrend.
Using this indicator, traders can combine different moving averages, watching which trend prevails on a senior timeframe in one window. Based on this factor, traders can make market entry/exit decisions in the direction of the prevailing trend and at the same time monitor the moving average on a short-term time frame.
IFX_AMA indicator
Description
The AMA indicator (or Adaptive Moving Average) was developed by Perry J. Kaufman and first presented in his book Smarter Trading: Improving Performance in Changing Markets in 1993. It is one of the most popular Forex trend technical indicators which is commonly used by traders on the currency markets worldwide.
Formula
When AMA(1) = Close
AMA = AMA(1) + α * (Close – AMA(1)), where
α = [(VI * (FC – SC)) + SC]²
Trading use
The AMA indicator by Perry Kaufman mainly differs from a standard moving average by a principle of calculation which directly depends on the market situation and price fluctuations. In case a price changes abruptly, a calculated period of the AMA indicator gradually decreases. When a price shows minor fluctuations, an AMA period extends. The AMA indicator serves to identify a trend direction on the forex market smoothing an average price from minor fluctuations.
Therefore, Kaufman’s Adaptive Moving Average is characterized by low sensitivity to price series noises and by a minimal lag for trend detection whereas other moving averages have such disadvantages as an unavoidable lag when an indicator’s period extends and an increasing number of false signals when an indicator’s period contracts.
The AMA indicator could be used on its own or jointly with other trading methods. In case IFX_AMA is used without other indicators:
- A trader should open a long position (or close a short position) when a price line crosses above an IFX_AMA line
- A trader should close a long position (or open a short position) if a price line crosses below an IFX-AMA line)
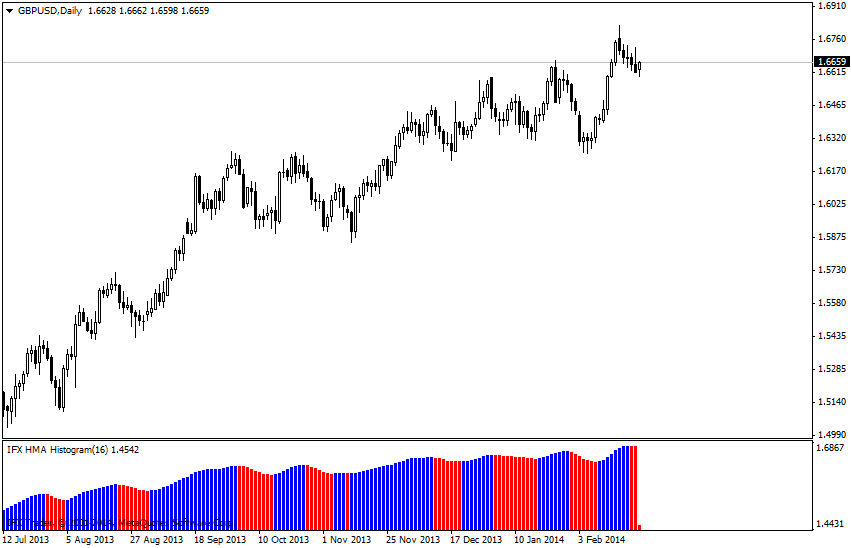
Description
The HMA_histogram indicator is a version of classical HMA indicator by Alan Hull in the form of histogram similar to the one of the MACD indicator.
Formula
HMA(n) = WMA(2*WMA(n/2) – WMA(n)), sqrt(n))
Trading use
The HMA_histogram is a trend indicator in the shape of histogram, bars of which indicate price movement direction (a blue bar points to rising, a red one suggests a fall) and entry points to the market.
If there is a general ascendant trend on the market, and the HMA_histogram has changed the color to blue from red, it is time to buy an asset as the price can rise further within the overall uptrend. The change of color is a signal to enter the market.
When there is a downtrend in the market and the HMA_histogram has turned red, we should sell an asset as the price can fall lower within the overall descending trend. When the indicator is changing the color, it is a signal for entry.
A special characteristic of this indicator is that it not only smoothes price changes but also allows you to exclude the lagging of signals. It became possible due to the particular formula. Thus, a trader may use this indicator in trading and be sure that the HMA_histogram will not give a lagging signal to buy or sell.
The HMA_histogram can be applied as a filter for entry to the market; in this case trades can be opened based on other indicators and analyses. The histogram can help you to determine the best time to close a deal: when the indicator changes the color to opposite one, an open trade in the direction of a price movement should be closed. Then, wait for next signal to enter the market.
HMA Indicator
Description
The Hull Moving Average (HMA) is one more alternative of an ideal MA that enables smoothing price movements with the help of weighted averages. The indicator was created by Alan Hull.
Formula
HMA(n) = WMA(2*WMA(n/2) – WMA(n)),sqrt(n))
Trading use
The HMA indicator was developed as an effective price filter. It includes standard functions of most moving averages; it influences the price as support/resistance and market entry decision-making on the basis of the angle of the curves inclination. But also, the Hull Moving Average allows a trader to determine the trend with the help of the color model built in the indicator.
In case an upward trend prevails, the HMA changes its color from red to blue, thus indicating a buying opportunity because the price may rise further after that. The change of color of the moving average would also signal a market entry.
The HMA not only smoothes price changes, but also eliminates signals’ delays. This effect was reached by virtue of some peculiarities in calculation. Thus, a trader can use the indicator in trades with no fears that the HMA would provide delayed signals to buy an asset or enter the market.
In addition to independent use of the HMA in trading, the MetaTrader indicator can be applied as market entry filter with trades being opened on the basis of other indicators or different methods of analysis. In this case, the moving average can be used for closing trades. The mechanism is the following: when the indicator changes its color to the opposite one, a trader should close a trade opened in line with the price trend and wait for a new market entry signal.
ATR Trailing Stop indicator
Description
The ATR Trailing Stop indicator enables traders to determine the points of stop loss after calculating the volatility level with the help of the ATR indicator. This method was applied in the 80s by the legendary Turtle Traders. Since then it has been a modern and effective way of Forex trading.
Formula
StopLoss = Low[0] - 2 * ATR(5, Close[1]-2*ATR(5), and High[0] - 3*ATR(5)
Trading use
The ATR Trailing Stop indicator for Metatrader contains one line displayed at the price chart. This line shows the price levels of the break-even area where stop loss can be set to maximize the profit from your trading activity.
Usually, to set a stop loss, the professional traders use the volatility level based on the ATR indicator. So, when the price is rising or falling towards the target level, the technical indicator will draw uptrend or downtrend pointing to the price level, which is supposed to be chosen as a stop loss. This indicator is calculated by the standard coefficient of volatility, which is equal to 2.5 and optimal to the most financial markets ( i.e. the stop loss level is going to be at the distance of 2.5*ATR).
This indicator is an optional one and should be used in manual trading.
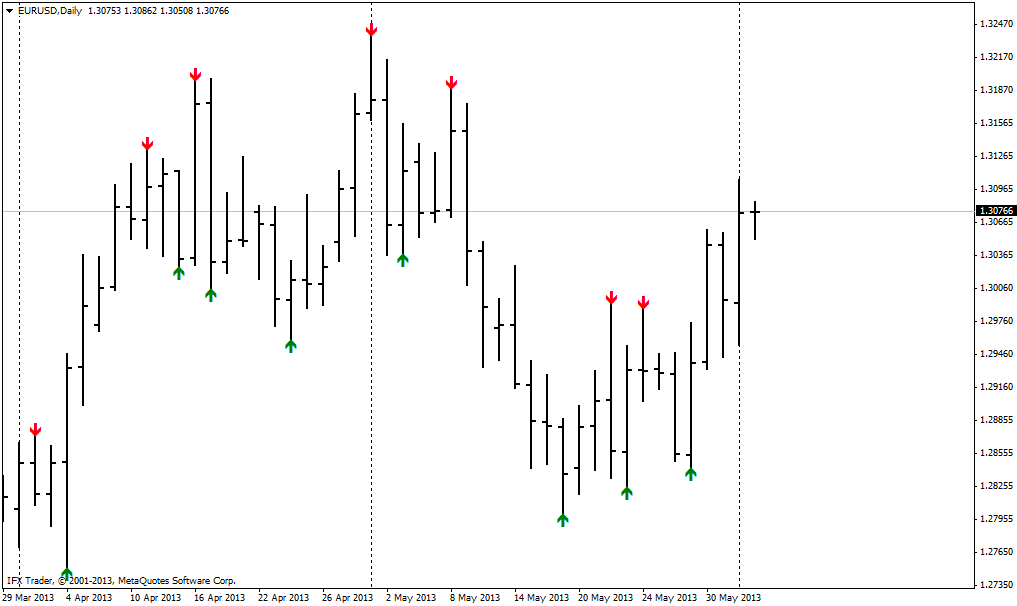
Larry Williams' Extremes
Description
The computer indicator Larry Williams' Extremes points to the presence of short-term price highs and lows on the market, described in Williams' book Long-Term Secrets to Short-Term Trading. This indicator can be used as an excellent addition to the trader's basic market entry techniques.
Formula
The indicator is built on the basis of the formed short-term price highs or lows, provided that recent days generated lower highs or higher lows as compared to the daily price levels.
Trading use
In his book Long-Term Secrets to Short-Term Trading, Larry Williams provides the following description of the market extremes: "I can define a short-term market low with this simple formula: Any time there is a daily low with higher lows on both sides of it, that low will be a short-term low. A short-term market high is just the opposite. Here we will see a high with lower highs on both sides of it."
The described feature of the price extreme makes it possible to identify short-term price reversals on a daily chart and, if there is a signal, place a trade in the direction of the reversal.
The MetaTrader indicator Larry Williams' Extremes developed by InstaForex enables you to clearly define the moment when a particular financial asset forms a short-term price high or low (from the point of view of the concept's author). In case there is a price extreme (high) on a currency pair's daily chart, the indicator will display a red arrow meaning that the formed pattern might be followed by a price decline. Conversely, if the price generates a short-term low, the indicator will show a green arrow confirming the buying possibility.
If you use this indicator as an independent tool of analysis, you should allow for the direction of emerging trends in order to exclude the possibility of entering the market against the general direction of the price movement.
The signals of the Larry Williams' Extremes indicator as an additional analysis instrument complement the basic technical or fundamental method of decision-making of the trading system.
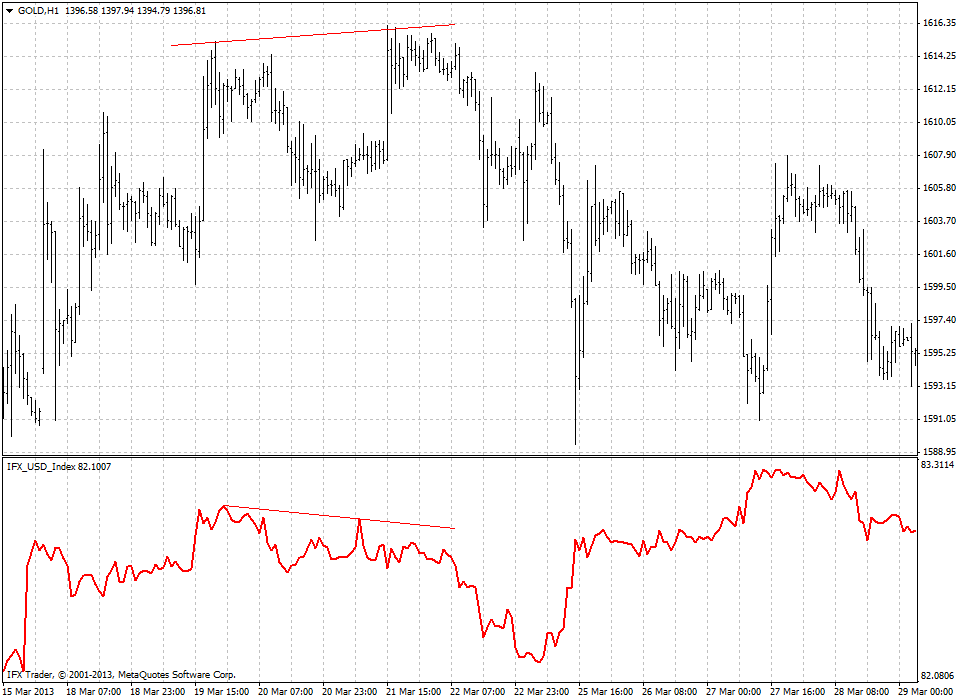
US Dollar Index
Description
The US Dollar Index is an average value of rate fluctuations of six major currencies (EUR, CAD, GBP, JPY, CHF, and SEK) against the U.S. dollar. The US Dollar index was invented in 1973 with initial value 100. In 1999 it was modified in order to keep track of the euro, which had just been introduced. The index is traded 24 hours on the NYBOT.
Formula
USD x = 50.14348112 × EUR/USD(0.576)× USD/JPY(0.136) × GBP/USD(-0.119) × USD/CAD(0.091) × USD/SEK(0.042) × USD/CHF(0.036)
Trading use
Computer indicator USD index enables traders to visually determine the dynamics of the US Dollar Index in relation to the basket of world major currencies.
From the point of view of practical use of the US Dollar Index in MetaTrader (including trading the EUR/USD major and other assets), the mainstream is defining divergence and convergence between the US Dollar Index and a financial asset.
- In case the US Dollar Index rises and the related financial asset (i.e. gold, crude oil) is rising too, it means that the price curve on the traded asset is about to reverse. Likewise, when the index and the price of an asset are falling, the price reversal of the latter is to take place in the short term.
- If there is a downward price movement on the currency pair chart, while the Euro index line is rising, it suggests divergence between the price and the values of the indicator. This situation means that soon the currency pair price will begin to rise.
- Alternative: if amid rising price there is a downward movement of the US Dollar Index, then downward reversal of the currency pair price is likely to emerge soon.
Note that! Before you start using the US Dollar Index in your trading, you should understand which of the financial assets mirror the U.S. dollar movement, and which ones move in the same direction.
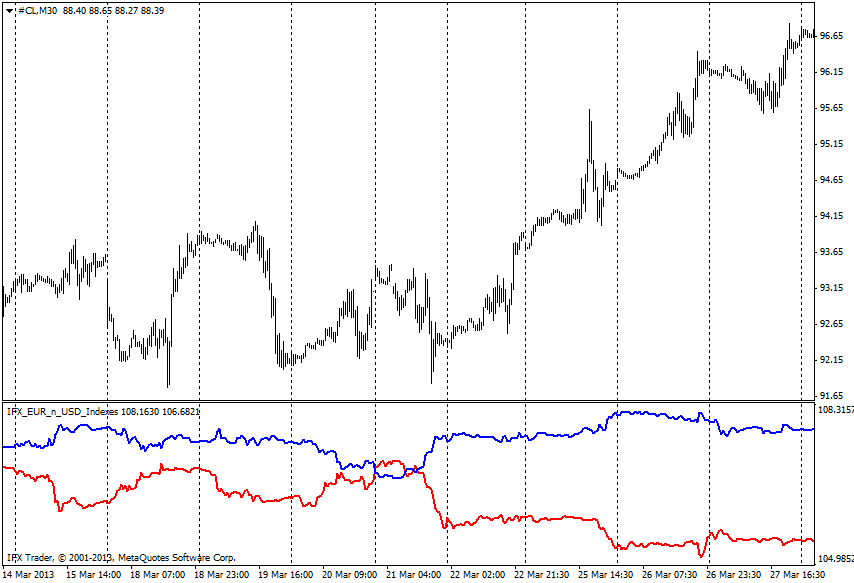
EUR_USD index
Description
EUR_USDindex is a combined indicator which consists of two separate ones: EURx and USDx (USDX). This indicator shows the changes in the both indices considering their correlation.
Formula
EURx=34.38805726*EURUSD^ (0.3155)*EURGBP^ (0.3056)*EUR/JPY^ (0.1891)*EURCHF^ (0.1113)*EURSEK^ (0.0785)
USDx = 50.14348112 × EURUSD (0.576) × USDJPY (0.136) × GBPUSD (-0.119) × USDCAD (0.091) × USDSEK (0.042) × USDCHF (0.036)
Trading use
Computer indicator EUR_USDindex, containing two indicators for the best performance, was designed to identify several major factors which can assist in active stock market trading.
From the practical point of view, EUR_USDindex is not a signal indicator for MetaTrader. As in the case with volatility, the index helps to define the subsidiary element.
- If EURx and USDx are in the wide range, it usually signifies the pronounced market trend. In this case it is possible to apply trend trading system.
- If EURx and USDx are in the close range, the market is in flat position. Thus, in such situation the break above resistance or below support levels would be more beneficial.
- The crossing of the two lines of the index confirms a new powerful market trend. In this situation the price can form new local lows or highs.
Euro Currency Index
Description
The euro currency index reflects average fluctuations of the world’s five major currencies (USD, GBP, JPY, CHF, and SEK) to the euro. The euro currency index, or EURX, was established in January 13, 2006, and is quoted on NYBOT. The index represents a benchmark for the euro value calculation against other participants of the financial markets.
Formula
EURx = 34.38805726*EURUSD^(0,3155)*EURGBP^(0.3056)*EUR/JPY^(0.1891)*EURCHF^(0.1113)*EURSEK^(0.0785)
Trading use
EURindex computer indicator shows the price changes in the euro currency index, which are entailed by price fluctuations in other major currency pairs on Forex.
From practical point of view, there are two ways of using the index for trading EUR/USD and other currency market instruments on Metatrader. The first one is associated with crossovers, and the second one is based on divergence.
- In case the euro index crosses the 50 SMA and 100 SMA to the upside or to the downside, it can be either a buy or a sell signal respectively. There are many ways to profitably exit the trade, taking into account a crossover. However, it is not recommended to use a reversal signal for closing a position.
- If the currency pair price chart demonstrates a descending move while the EURX is going up, then divergence is observed. Thus, currency pair quotes are likely to grow soon.
- On the other hand, if the EURX is sliding down amid the price surge, it can be a notable clue that the market might turn downwards.
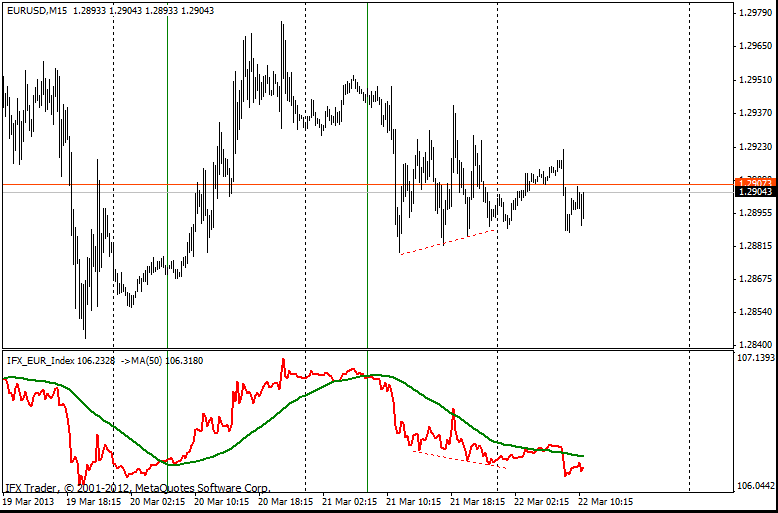
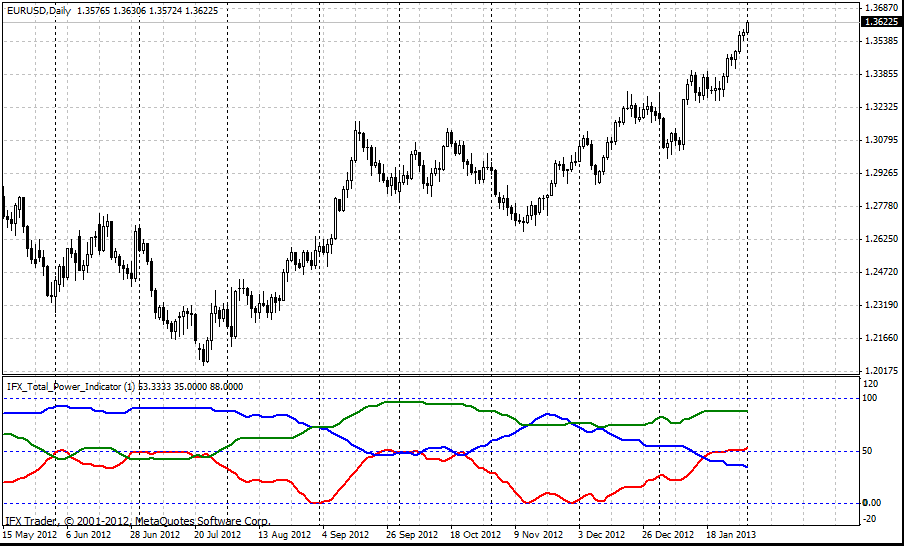
Total Power Indicator
Description
The indicator was developed by Daniel Fernandez in 2011 and it was described in the magazine Currency Trader. The indicator is revised version of the Alexander Elder’s Elder-Ray indicator, which is based on the power strength of bears and bulls, as well as the 13-day EMA.
Formula
Total Power = Abs (BearCount - BullCount)*100 / Lookback Period;
BearPower = BearCount*100/ Lookback Period;
BullPower = BullCount*100/Lookback Period.)
Trading use
The Elder-ray index was developed to determine trends; the idea of bulls and bears pressure was basic for the index.
The method used in the Elder-ray index is based on three technical indicators, which show the way bullish and bearish price fluctuations are formed according to consensus price. The index includes the 13-day EMA and two Alexander Elder’s indicators - Bull and Bear Power.
The drawback of this approach is the following one it does not make clear signals on market entrance amid absence of global outlook for price movements.
The Total Power Indicator (TPI) for metatrader was developed to provide particular outlook for the market price changes, as well as the difference between current prices and the previous ones.
There are several methods to use this technical indicator:
- if the level of 100 is reached by levels of Bull (or Bear in terms of sell) and Total and if it is so, then open buys (sells in case the line is Bear);
- if Bear and Bull lines are crossing, i.e. if Bull line crosses Bear line from the bottom upwards, then buy, if Bear line intersects Bull line from top downward, then sell;
- if Bull/Bear lines are crossing with indicator lines, i.e. if the line Bull/Bear intersects the level of 50, then one may open buy/sell.
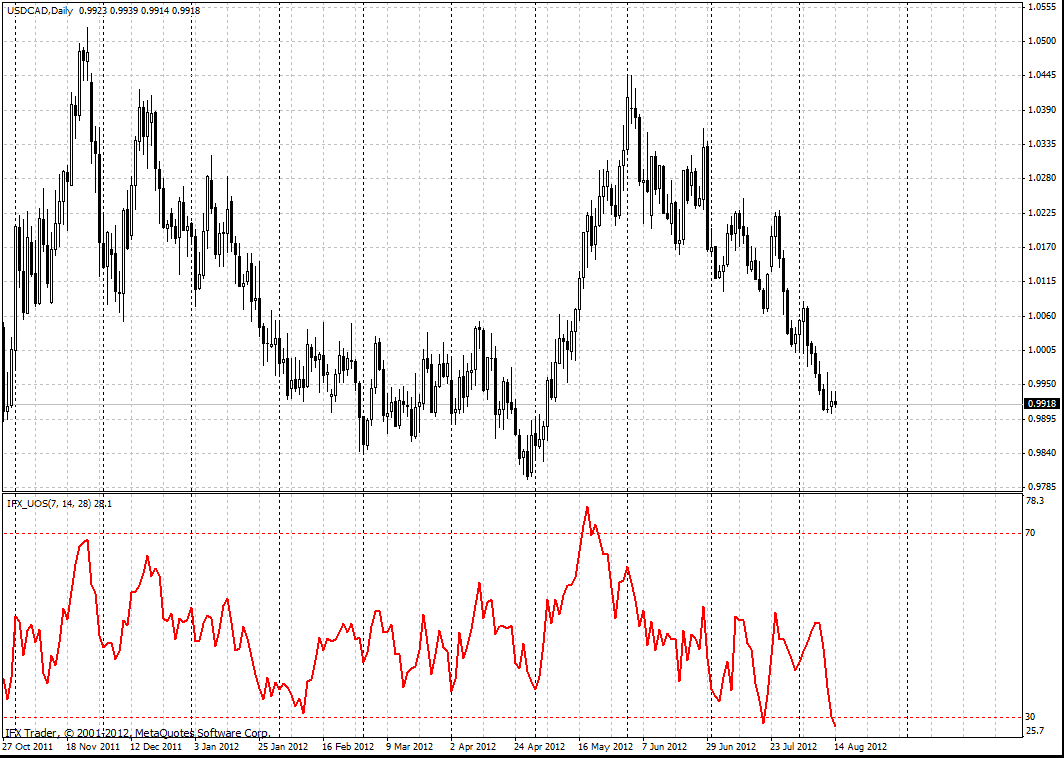
Ultimate Oscillator
Description
Ultimate Oscillator was developed by Larry Williams in 1985 and described in Technical Analysis of Stocks and Commodities Magazine. This indicator can be related to classical oscillators for technical analysis. However, Ultimate Oscillator surpasses other indicators by the data analyzed and the strength of its signals. It uses weighted average of three different time periods.
Calculation
- Determine the current True Low, TL. TL - is the lowest current minimum or the previous closing price.TL (i) = MIN (LOW (i) || CLOSE (i - 1))
- Calculate current Buying Pressure, BP is equal to the difference between the closing price and the True Low.BP (i) = CLOSE (i) - TL (i)
- Get the True Range, TR. This is the biggest difference of the current low and high; or current high and the previous closing price; previous closing price and the current low.TR (i) = MAX (HIGH (i) - LOW (i) || HIGH (i) - CLOSE (i - 1) || CLOSE (i - 1) - LOW (i))
- Count the sum of BP indicators for all time periodsBPSUM (N) = SUM (BP (i), i)
- Compute the sum of TR indicators for all three time periodsTRSUM (N) = SUM (TR (i), i)
- Identify the Raw Ultimate Oscillator, RawUORawUO = 4 * (BPSUM (1) / TRSUM (1)) + 2 * (BPSUM (2) / TRSUM (2)) + (BPSUM (3) / TRSUM (3))
- Calculate Ultimate Oscillator, UOUO = ( RawUO / (4 + 2 + 1)) * 100, where
MIN - minimum reading;
MAX - maximum reading;
|| - logical OR;
LOW (i) - lowest price of the current bar;
HIGH (i) - highest price of the current bar;
CLOSE (i) - closing price of the current bar;
CLOSE (i - 1) - closing price of the previous bar;
TL (i) - True Low;
BP (i) - Buying Pressure;
TR (i) - True Range;
BPSUM (N) - sum of BP readings for N period (N which is equal to 1 is i = 7 bars; when N = 2, i = 14 bars; when N = 3, i = 28 bars);
TRSUM (N) - sum of TR readings for N period (N which is equal to 1 is i = 7 bars; when N = 2, i = 14 bars; when N = 3, i = 28 bars);
RawUO - Raw Ultimate Oscillator reading;
UO - Ultimate Oscillator reading.
Trading Use
aking into account that Ultimate Oscillator is used for technical analysis and it fluctuates in the range from 0% to100%, the baseline of Ultimate Oscillator can be regarded as oversold/overbought indicator for the market. If the indicator demonstrates the reading above 70 level, the market is overbought and there will be a trend reversal soon. In case the indicator dropped below 30 level, it will be possible to observe prices growth soon.
It is necessary to consider so-called Gambler's Fallacy factor while using this kind of method based on Ultimate Oscillator (as well as any other technical oscillator).
Larry Williams suggested absolutely different approach when using this indicator, but it is very relevant for modern exchange markets now:
- if there is bearish divergence amid price growth and the indicator falls below 50 level, it is necessary to open short positions. In case the price sinks below 30 level, close short positions;
- if there is bullish convergence amid price drop and the indicator is above 50 level, open long positions. When the price overcomes 70 level, close long positions.
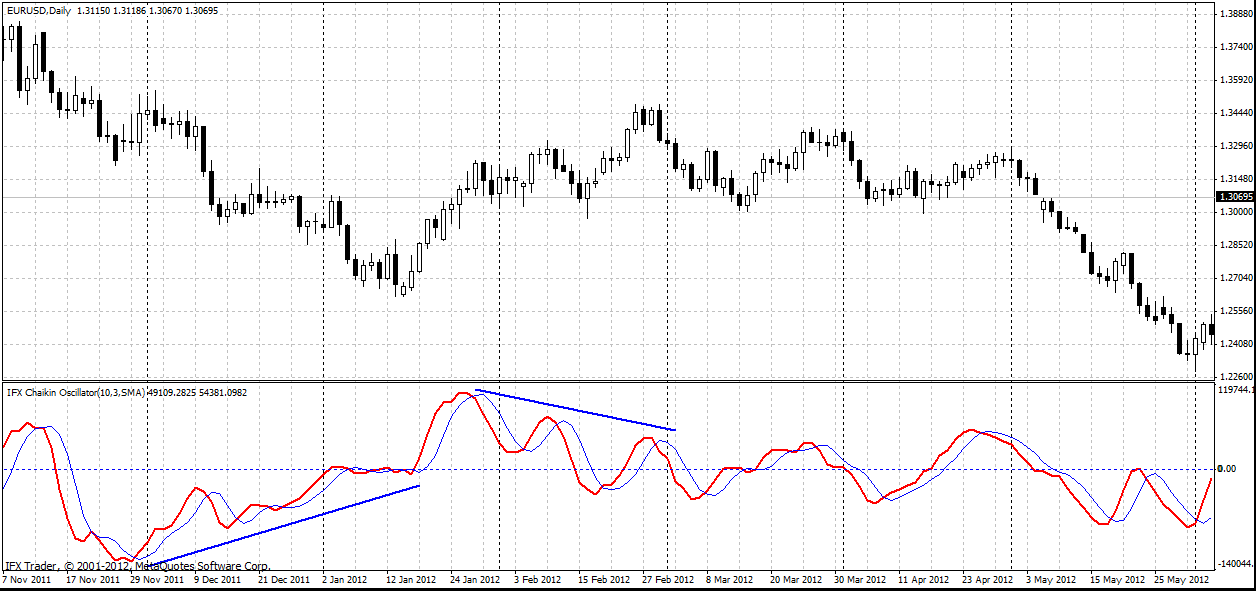
Description
The Chaikin Oscillator (CHO) was developed by analyst Marc Chaikin. The Oscillator is based on Larry R. William's Accumulation/Distribution index (A/D). In fact, the Chaikin Oscillator is MACD indicator, but the oscillator is based on the A/D figures, not the price.
Calculation
- First of all, the Accumulation/Distribution index should be calculated.AD = {[(Close - Low) - (High - Close)] / (High - Low)}*Volume
- Then, we have to calculate the Chaikin Oscillator.Chaikin Oscillator = SMA(AD, m) - SMA(AD, n),
where m is bigger order of average, n is lower order of average.
Trading Use
Classic index usage is to open trades towards oscillator's lines pertaining to zero level. When the CHO is above zero, it suggests an emerging upward price trend. In this case, it is recommended to place a long trade. If the indicator is below zero, as a rule, the price is likely to continue moving downward. Consequently, traders should take into account a bearish outlook.
The Chaikin Oscillator forms bullish and bearish convergence/divergence in terms of price chart, along with the majority of oscillators used in technical analysis. Moreover, using this feature one should take into account the fact that in most cases divergences and convergences of the Chaikin index consist of 2 or 3 consecutive dynamic movements. This rule allows to filter a considerable amount of single signals, as they are often not worked out by the market.
The one of the most interesting methods of the CHO's application is its building and the market analysis combined with sliding average (SMA, 3), moved by 1 bar to the right in relation to the chart of the Chaikin Oscillator.
By using this approach, it is necessary to respond to the situation when sliding average moving downward crosses lines of the index in terms of the probability of price drop and upward in terms of price rise. In this case the signal is leading. However, it can be false if divergence and convergence have not formed on the oscillator.
Despite the decrease in the number of signals, usage of additional filter provides you with better signal sampling.
0 comments:
Post a Comment